Scientific image analysis
Oxel User Guide
Explore image volumes, define regions, process pixels, and turn measurements into useful results.
Oxel is a native desktop application for scientific images. Its workspace combines familiar image tools with channels, Z stacks, time series, and linked volume views. This guide covers the features implemented in the accompanying application, including the differences between a visual preview and the numeric data used for analysis.
Open this guide from or press F1. Start with a task, or use the contents and search to find an exact control. Menu paths use ; bold names identify controls in the application. Keyboard shortcuts use Cmd on macOS and Ctrl on Windows unless a table specifies otherwise.
01 · Get started
Your first image
This short workflow works with an ordinary TIFF or a supported scientific volume. Use a copy of your own data so you can experiment and compare the result with the original.
- Choose , select an image, and wait for its first frame to appear. For a DICOM series or local Zarr store, choose instead.
- Choose . Check the width, height, pixel type, and the number of channels, slices, and frames. Close the information dialog.
- Choose . If the inspector is hidden, choose .
- Select the Display inspector. Adjust Minimum and Maximum, or use Auto. These changes reveal detail without changing measured intensities. You do not need to press Apply to use the new display.
- For a stack, use the bottom Z slider. Use the channel selector and time slider when those axes are present. Confirm the displayed C/Z/T position before analysis.
- Choose the Select (rectangle) tool and drag over an area. Select . The Results table appears. Without a selection, Measure analyzes the current full XY plane.
- Use Save CSV… in Results to save the measurements. If you made image edits, use to save a separate image.
The default area-measurement settings include area, mean intensity, minimum, maximum, and stack position. Channel, slice, and frame columns are added when those axes contain multiple positions. A spatially calibrated image reports physical geometry; an uncalibrated image reports pixel geometry.
Practice without a dataset
Choose , select Horizontal ramp, and create an 8-bit grayscale image. Draw rectangles at different X positions and measure them. Mean values increase from left to right, while changing the Display LUT changes the colors without changing those values.
You have verified the distinction between display appearance and source intensity.
02 · Get started
The workspace
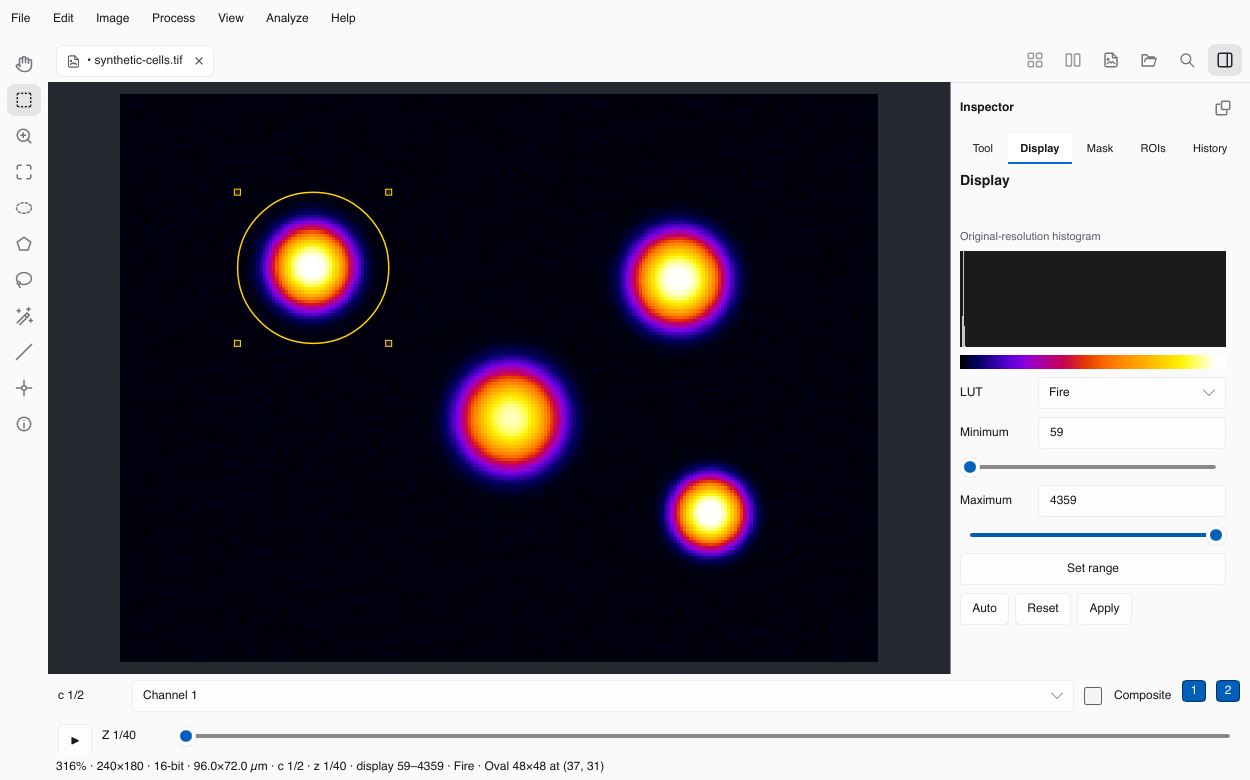
The center canvas displays the active document. Each open image has a tab, its own zoom and pan position, display settings, selected view, and volume crosshair. Switching tabs restores that image’s view. New images fit the canvas when first displayed.
| Area | Purpose |
|---|---|
| Document tabs | Switch between source and derived images. Close a tab with its close button or . A changed image prompts you to save before closing. |
| Tool rail | Choose Pan, Select (rectangle), Oval, Polygon, Freehand, Line, Point, Wand, or Zoom. Fit and zoom controls are nearby. The ⓘ button opens image information. Hover over an icon to see its name. |
| Inspector | Tool holds tool and selection settings. Display controls contrast, LUTs, and viewing resolution. Mask holds thresholds. ROIs holds saved regions. History shows image edits. |
| Position controls | Navigate C (channel), Z (depth), and T (time). Composite blends visible channels; Visible controls whether the active channel contributes. |
| Bottom information bar | Check image dimensions, position, loading or processing messages, and exact pixel values under the pointer. A slider destination can be ahead of the frame still loading; the pixel readout describes the displayed frame. |
| Results | Review accumulated measurements in an overlay at the bottom of the image or in a separate window; measure again, save CSV, clear the table, or hide it. |
Inspect image information
Use the ⓘ button on the left, , or Cmd/Ctrl + I. The report shows dimensions, pixel type, current calibration and display settings, and retained source metadata. Select text to copy part of it, choose Copy for the whole report, or Save text… to export it. The report describes the image when opened.
Find a command by task
Choose or press Cmd/Ctrl + Shift + P. Search a command name or a supported task phrase, such as “count cells.” Select a result and choose Run. The command opens its normal settings or runs its normal action.
Adjust the workspace
New images initially fit and center in the space beside the inspector. That centering stays with the image: the inspector and Results slide over it without changing its size, zoom, or position. An explicit Fit Image command fits the currently visible area. Use the top-bar inspector icon or to reveal the image underneath. Results has a minus icon to hide it. Drag the inspector’s left border or Results’ top edge to resize the overlay. Choose the small overlapping-window Pop out icon at the right of either panel header to move it into an independent, movable and resizable window. Choose the Dock icon, or close that window, to return the panel to the image. Floating panels stay connected to the active image and live Results table. Hiding a floating panel remembers its location; showing it again restores the separate window. Use to change the palette; your choice is remembered between launches. On macOS, workspace actions appear in the native title bar; On Windows, these actions share the document-tab row, at its right edge.
Compare open images
Choose multiple files in Open and select Separate Tabs. Use , the two-column icon in the top bar, or search for Side by side in Commands. The adjacent Tile overview icon shows fitted previews of all open images; click a tile to open that image. Overview has no comparison controls or camera gestures. Click the active layout icon again to return to the single image. Each pane shows that image’s current C/Z/T plane.
Linked cursors shows the same original-image pixel coordinate in every pane, accounting for each pane’s zoom and pan. Use calibration instead matches physical distances from the image origin when unit names agree. Incompatible units and positions outside an image show no cursor; this does not register misaligned images or copy selections.
Click a pane to make it active. In side-by-side view, drag to pan; the Zoom tool zooms in on click and out on Alt-click or right-click. Trackpad pinch and Ctrl/Cmd-scroll zoom around the pointer; + and − zoom the active pane. The Hand tool, Space-drag and Shift-drag also pan. Fit all resets comparison cameras. Double-click a pane or choose Single image to return to normal editing. Comparison cameras are remembered separately, and opening or hiding panels does not resize the panes.
Enable Sync position to align other panes with the active image, then pan and zoom them together. Positions and zoom match source pixels; Use calibration matches physical positions and horizontal scale for images with the same unit. It does not register images or change their C/Z/T planes. Turning sync off keeps the current views. Fit all fits each preview independently; the next navigation gesture resumes synchronization.
Drag the divider between side-by-side panes to resize them. Drag the right edge of the comparison area to use more or less canvas space. Image scale and centre position stay fixed as the pane changes size; Fit all fits the images to their new sizes. Divider widths are remembered for each open image. A focused divider also accepts Left/Right arrows, or Shift+Left/Right for larger steps.
03 · Get started
Pixels, channels, depth & time
An Oxel image has X and Y dimensions and up to three additional axes: C, Z, and T. A plane is one XY image at a particular channel, slice, and time. Understanding this model prevents processing the wrong data or confusing a channel with a depth slice.
| Axis or term | Meaning | Example |
|---|---|---|
| X / Y | Horizontal and vertical pixel positions in a plane. | A 2048 × 1024 image contains 2048 columns and 1024 rows. |
| C · channel | A distinct scalar signal or acquisition channel. | Two fluorescence signals displayed with separate LUTs. |
| Z · slice | A plane along the volume’s depth axis. | 80 slices separated by 2 µm. |
| T · frame | A position in a time series. | 30 frames, each containing the same C/Z grid. |
| RGB | Red, green, and blue components stored together in each pixel. | A color photograph. RGB is different from three independent scientific channels. |
| Voxel | A sampled element of a volume, with XYZ spacing. | 0.5 × 0.5 × 2 µm; the Z spacing differs from the XY spacing. |
Position controls and result columns show channels, slices, and frames starting at 1. Source pixel coordinates start at 0. Area centroids use pixel centers, so a pixel at X=0 has its center at X=0.5 before calibration.
Pixel types
Oxel’s scientific pixel model supports unsigned 8-bit values, unsigned 16-bit values, 32-bit floating-point values, and RGB8 color. Signed 8-bit and 16-bit scientific samples widen exactly to float32. Unsupported wider scientific types are rejected instead of being silently reduced. Some ordinary image-file variants use an RGB8 conversion; see file formats.
Display contrast maps numeric values to screen brightness. A 16-bit pixel remains a 16-bit value when you make it brighter on screen. converts the stored type and can change or reduce numeric precision.
Check an imported axis interpretation
Inspect . ImageJ TIFF and named scientific-volume metadata can restore C/Z/T. An ordinary multi-page TIFF or image sequence usually becomes a Z stack. If you know the flattened plane order and intended dimensions, use ; C × Z × T must equal the number of planes. This reshapes the interpretation, without registering or resampling images.
04 · Get started
Open images & volumes
Open one file
Choose or drag a supported file into Oxel. Use to reopen a recent source. A volume may open quickly from its metadata and load plane data only when requested.
Open several images
Select multiple files in the Open dialog. When Oxel offers opening choices, choose separate tabs to preserve individual images, or a stack when the files are consecutive planes of one image. Sequences use natural filename order and require matching plane dimensions and pixel types. Multi-page files contribute their pages when loaded as a selected-file sequence.
can import an ordinary folder as a virtual image sequence. Compatible images load on demand; incompatible or unreadable candidates can be skipped, with the count shown in the status. Check the final plane count before measuring. A folder with recognized channel groups can offer a channel interpretation. Verify the resulting C/Z/T axes rather than assuming filename order describes the experiment.
Open a DICOM series
- Choose and select the series folder, or select several DICOM files in Open.
- Oxel groups files by Series Instance UID and sorts spatial slices by patient-space slice position. Distinct series open separately; filename order is not used to define their geometry.
- Check the slice count, spacing, display window, and retained source geometry in .
Explicit temporal positions can produce a Z/T grid. Regular spatial multi-frame data is supported when metadata identifies an unambiguous grid. Irregular, duplicated, skewed, or inconsistent series are rejected rather than assembled into an approximate volume.
Open NIfTI or MetaImage
Open .nii or .nii.gz, or a NIfTI .hdr/.img pair with both files available. Open a MetaImage .mhd with its referenced raw payload accessible, or an embedded .mha. Compressed volumes may need time and temporary disk space for their initial expansion. Their subsequent slices remain lazy.
Open local Zarr / OME-NGFF
Choose and select the store or its parent folder. You can also open its zarr.json or drop the store folder into Oxel. Parent-folder discovery searches up to three folder levels. Nested image collections, NGFF plate/well fields, bioformats2raw series, and Xerra channels/exposures can open as separate tabs. A multichannel array stays one C/Z/T document. Label groups are excluded.
05 · Reference
Supported file formats
Use this table to choose an import route. Support refers to the current Oxel implementation; a format name does not imply that every encoding or metadata variant is supported.
| Format | Open with | Supported behavior |
|---|---|---|
TIFF / ImageJ TIFF.tif .tiff | Open | 8/16-bit grayscale, float32, RGB8, and RGBA8 imported as RGB8 with alpha discarded; signed 8/16-bit widened to float32. ImageJ hyperstacks restore C/Z/T, calibration, display windows, and LUTs. Ordinary pages become Z. Large decoded stacks can be virtual. |
| PNG, JPEG, BMP | Open | Ordinary image decoding. Supported grayscale 8/16-bit variants preserve those values; other variants can be converted to RGB8. JPEG compression is lossy. These formats are not substitutes for calibrated scientific-stack TIFF. |
JPEG-LS.jls | Open | Single-component 2–16-bit data, including SPIFF-wrapped 12/16-bit Xerra images. |
| NIfTI-1 / NIfTI-2 | Open .nii .nii.gz .hdr .img | Both byte orders; supported scalar types, RGB24, channels and time. Header intensity scaling is applied to float32. Original qform/sform metadata is retained. |
| DICOM Part 10 | Open file or Open Folder for series | Native 8/16-bit monochrome, signed stored-bit fields, modality rescale, MONOCHROME1 inversion, RGB8; JPEG, JPEG-LS, RLE, and JPEG2000 frame decoders. Regular spatial/temporal grids. |
| MetaImage | Open .mhd .mha | Binary 2D/3D/4D; either byte order; embedded/detached payloads; interleaved channels; RGB8; zlib compression. XYZ spacing uses millimetres. |
| Zarr v2 / v3; OME-NGFF 0.4 / 0.5; Xerra | Open Folder, drop store, or Open zarr.json | Local arrays and collections, named axes, lazy chunks, declared resolution pyramids and channel metadata. Standard bytes/gzip/zlib/zstd/Blosc codecs, transpose, v3 indexed sharding, and supported Xerra codecs. |
Scientific types and geometry that are deliberately rejected
UInt32, Int32, Float64, complex data, and unsupported higher dimensions cannot be preserved in the current scientific pixel model. TIFF, NIfTI, MetaImage, and Zarr readers reject unsupported scientific types rather than silently narrow them. MetaImage/Zarr nonzero physical origins and non-identity directions/transforms are currently rejected. NIfTI/DICOM source affines are retained as provenance, but measurements use axis spacing, and the viewer does not anatomically reorient the data.
DICOM encodings and layouts that are not supported
Deflated whole datasets, palette color, floating pixel data, nonlinear modality LUTs, VOI lookup tables, and SIGMOID windowing are unsupported. Ambiguous multi-frame layouts and duplicated, irregular, skewed, or inconsistent spatial grids fail explicitly. Inspect the reported error and use a separate, validated conversion workflow if needed.
Zarr / MetaImage details and unsupported stores
Unnamed 2D and 3D arrays are interpreted as YX and ZYX. Higher ranks require axis names, except supported Xerra RGB ZYXC. MetaImage ASCII, LIST, and pattern payloads are unsupported. Remote/object-store URLs, ZIP Zarr stores, and nested Xerra sharding are unsupported. When a group declares several named multiscale representations, Oxel uses the first. Xerra cft_zarr.shift12jls expands 12-bit values by four bits; retain that encoding detail when comparing numeric values with another reader.
Save formats: Save As supports TIFF, PNG, JPEG, JPEG-LS, JPEG 2000, Zarr, OME-Zarr, DICOM, MetaImage, and NIfTI. TIFF preserves the complete editing document; other formats save the scientific pixels within their supported limits. Results save as CSV. ROI sets use ImageJ .roi or ZIP. Presentation images export as PNG/JPEG; movies export as H.264 MP4 on macOS and Windows. Surface mesh export is not supported.
07 · Visualize
Brightness, color & channels
Choose the Display inspector or . Display settings belong to the active channel.
- Select a channel using the channel selector.
- Enter Minimum and Maximum, then choose Set range, or adjust their sliders. Minimum must not exceed Maximum.
- Choose a LUT to map scalar intensities to colors. The color ramp shows the mapping.
- For several channels, enable Composite and choose each channel’s Visible setting.
Auto estimates a useful contrast range from the current plane’s histogram. Reset returns the range to that plane’s observed minimum and maximum. Full-resolution histogram reading can take time for a large or compressed plane. Wait for the histogram/loading status, or enter a known numeric window directly.
LUT choices
Grays, Inverted, Fire, Ice, Spectrum, HiLo, Red, Green, Blue, Cyan, Magenta, and Yellow are available through Display or . Imported custom LUTs retain their current name until replaced. RGB images use their own stored colors; their display does not use the scalar-channel LUT selector.
Composite appearance and measurements
Composite blends the visible channels into a color view. Measurement and threshold tools still work on the active scientific channel; a bright composite pixel does not represent one combined measurement value. Use to create a separate RGB image when you need the rendered colors as pixels.
08 · Explore
Explore a volume
Open data with at least two Z slices, then choose . The selected view remains inside the document workspace. Channel and time remain separate from spatial depth.
| View | Displayed axes | Navigation through the volume |
|---|---|---|
| XY | X horizontally; Y vertically. | The Z slider or wheel changes depth. Pixel editing and selection measurements are available. |
| XZ | X horizontally; Z vertically. | The slider or wheel moves through source Y rows. |
| YZ | Y horizontally; Z vertically. | The slider or wheel moves through source X columns. |
| Orthogonal | Linked XY, XZ, and YZ panes in a two-by-two grid; the fourth pane is empty. | Drag a crosshair or enter X/Y/Z positions. A wheel over a pane changes its normal axis; Cmd/Ctrl-wheel zooms that pane. Each pane has its own zoom and Fit controls. Shift + left drag pans a zoomed pane without moving its crosshair. |
Cross-section proportions follow XYZ spacing. Without calibration, Oxel uses unit voxel spacing. Cursor readouts report the corresponding original X/Y/Z coordinates and scalar or RGB value. Hovering does not move the crosshair.
Acquired CT and MRI examples
These screenshots use the public CT-MR Brain / CTBrain and MRHead samples from the 3D Slicer project. The people visible donated these particular datasets for unrestricted use. They were converted to NIfTI without changing intensity values; the MRI axes were permuted/flipped without interpolation to show an axial XY plane. Sources and license terms are included in this guide.
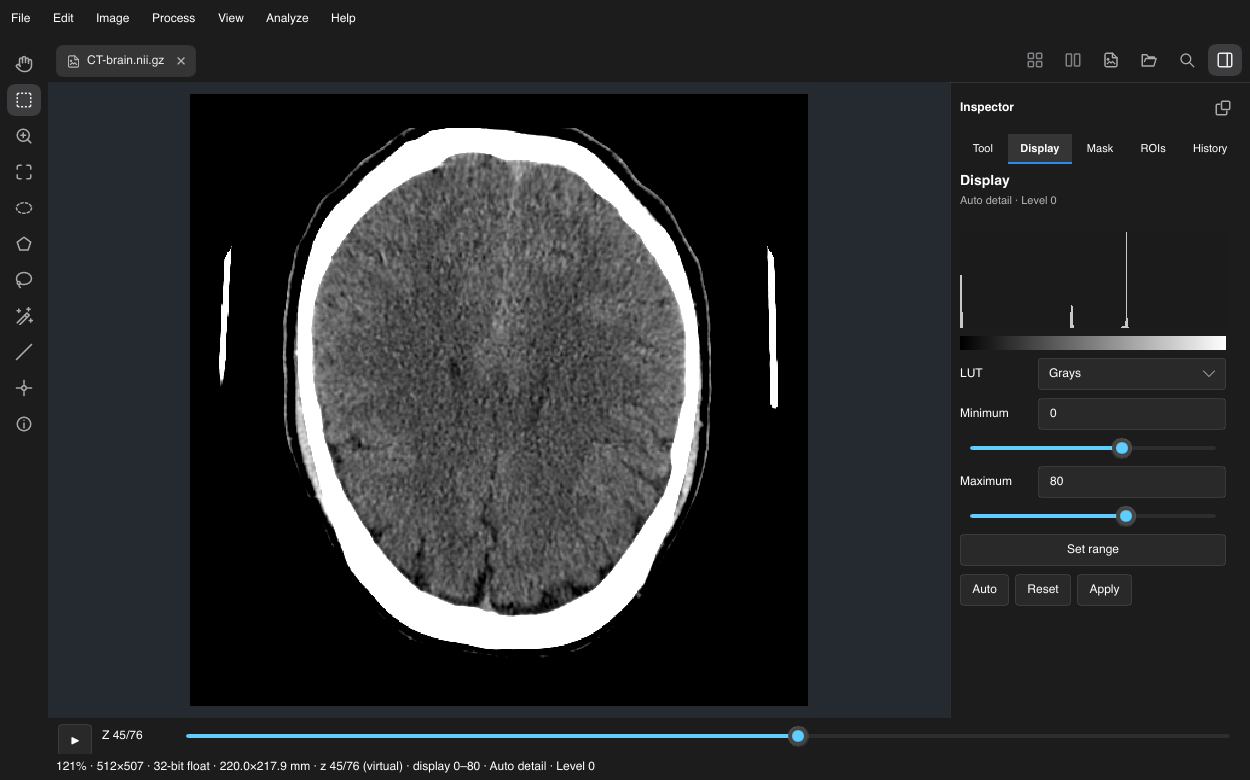
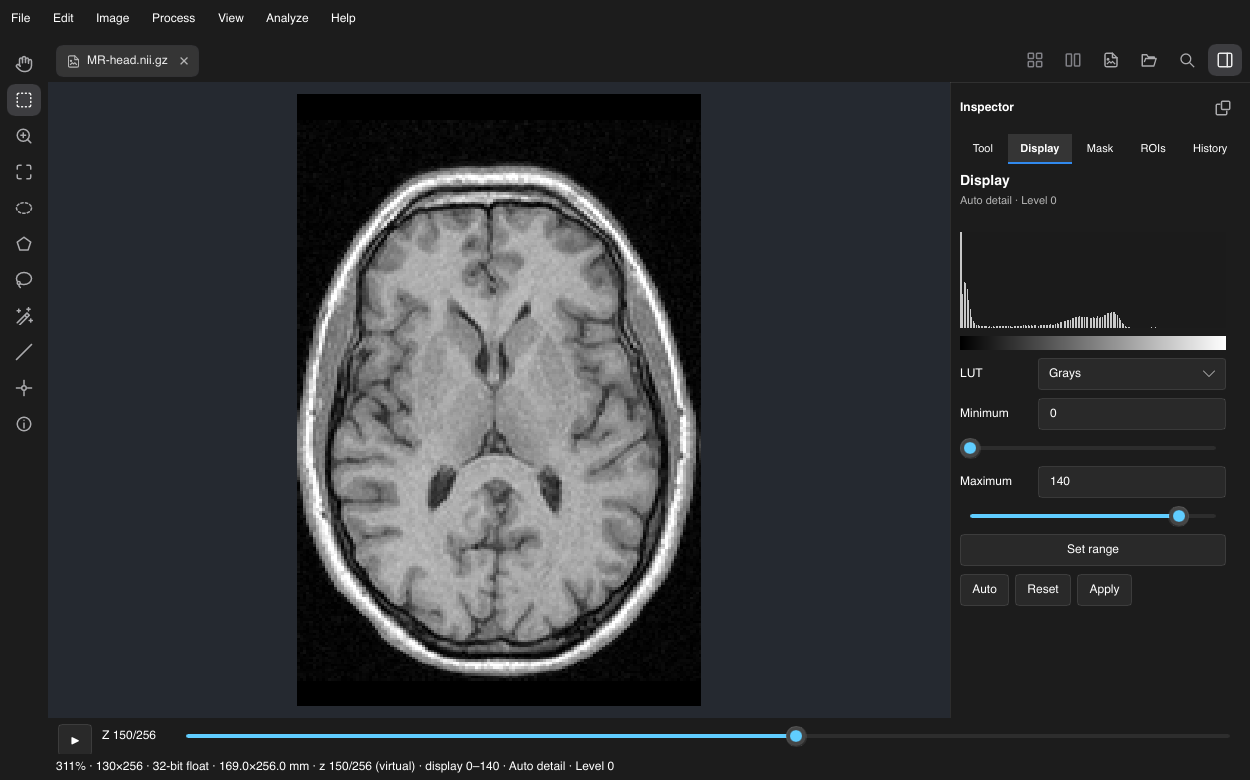
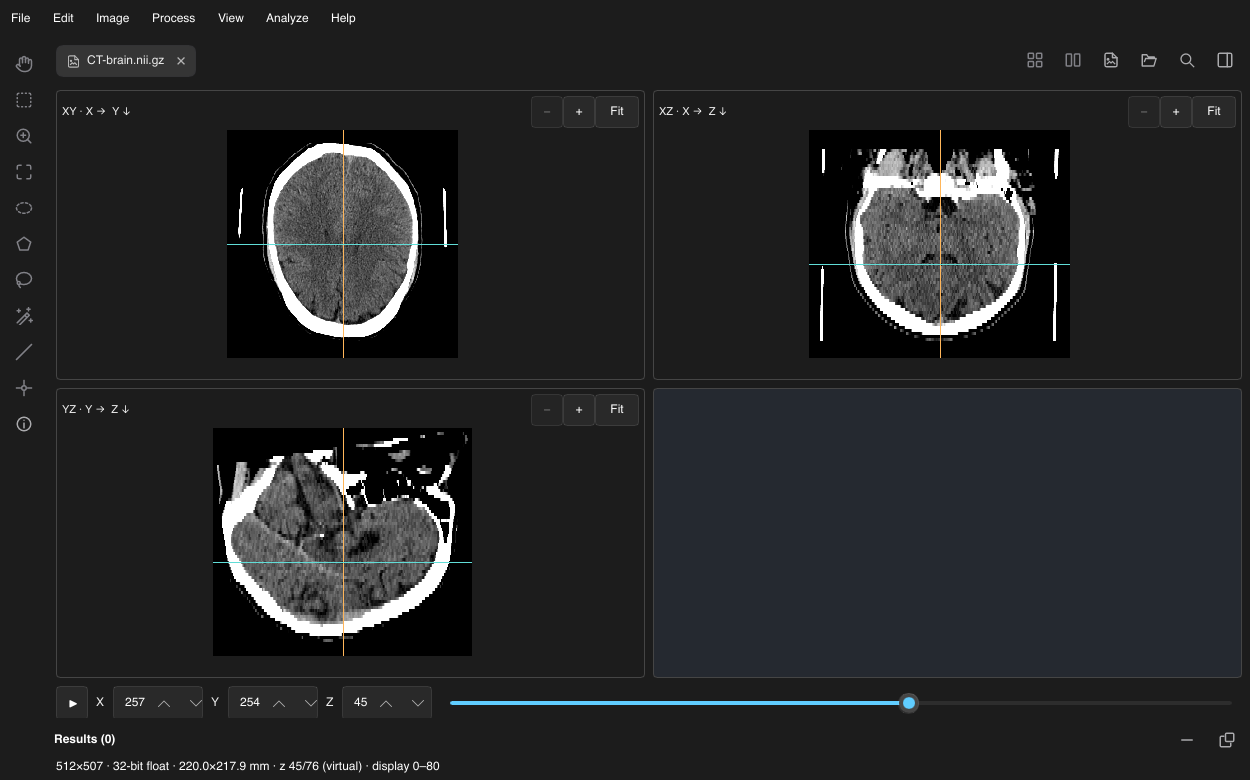
Inspect the same structure in three orientations
- Choose .
- Drag a crosshair onto a structure in XY. The XZ and YZ panes move to intersect that point.
- Scroll in a second pane to follow the structure along its normal axis.
- Zoom or Fit individual panes as needed. For a pyramid source, viewing resolution can differ between panes to match each pane’s zoom.
- Return with before drawing a selection or editing pixels.
Medical images are displayed along their stored voxel axes. “XY” is not a promise of axial anatomy, and Oxel does not reorient an oblique source into anatomical planes. Read the original NIfTI/DICOM affine in .
09 · Visualize
MIP & surface rendering
and display a rotatable 3D view. Drag the canvas to rotate. Hold Shift and drag with the left mouse button to pan. Scroll or pinch to magnify. Fit recenters the scene and resets zoom while keeping its orientation. Calibrated XYZ proportions are retained.
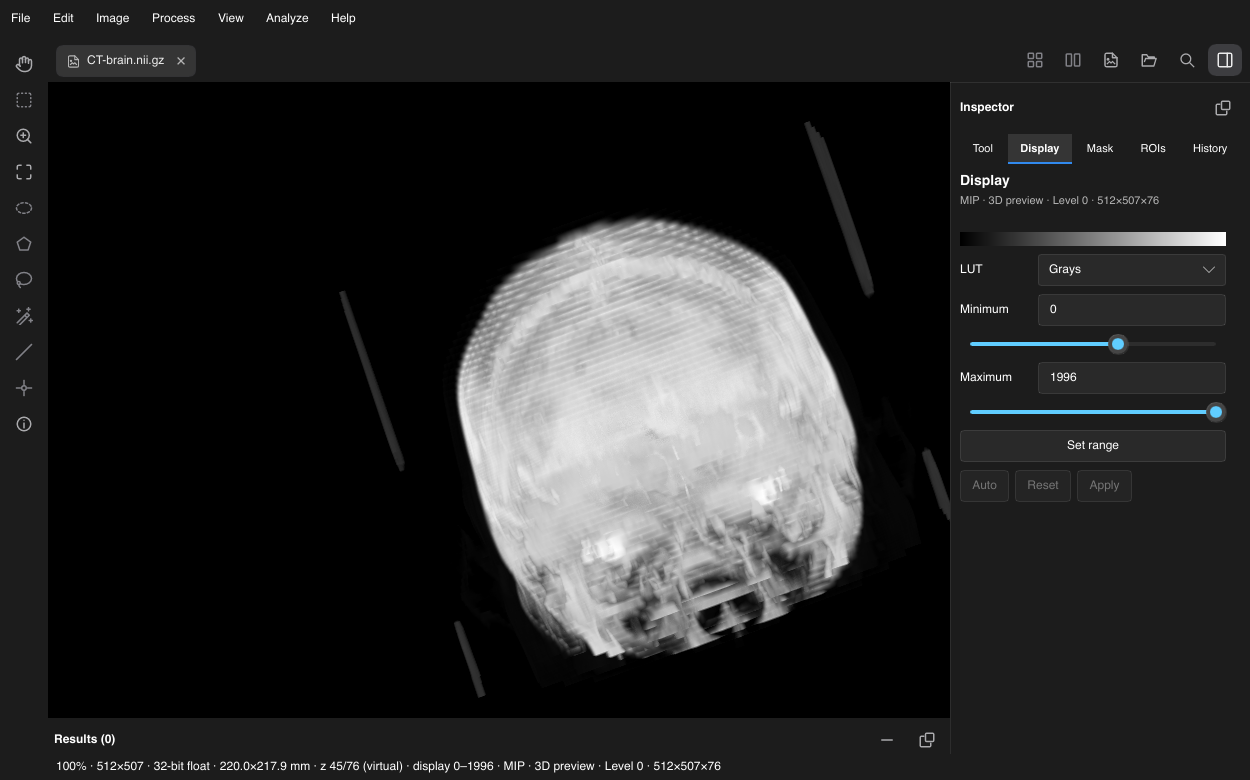
MIP · maximum-intensity rendering
MIP finds maxima along each viewing ray, then applies channel LUTs and blends the visible channels. It is useful for bright structures distributed through depth. Rotation changes which structures overlap. Right-click the MIP canvas and choose Play for a vertical-axis spin; choose Stop to hold the angle. Manual navigation, opening a dialog, or switching views stops the spin.
Surface · an intensity-defined boundary
Surface shows the first interpolated crossing of a channel’s Display minimum, with lighting based on physical XYZ spacing. Adjust Minimum to change the cutoff and choose a channel LUT for its color. Surface uses a stable bright color from that LUT, preferring a colored entry over a white endpoint; grayscale LUTs keep a neutral material. The surface is an image preview; it does not generate an editable segmentation or exportable mesh. Its smooth lighting does not blur or denoise source pixels.
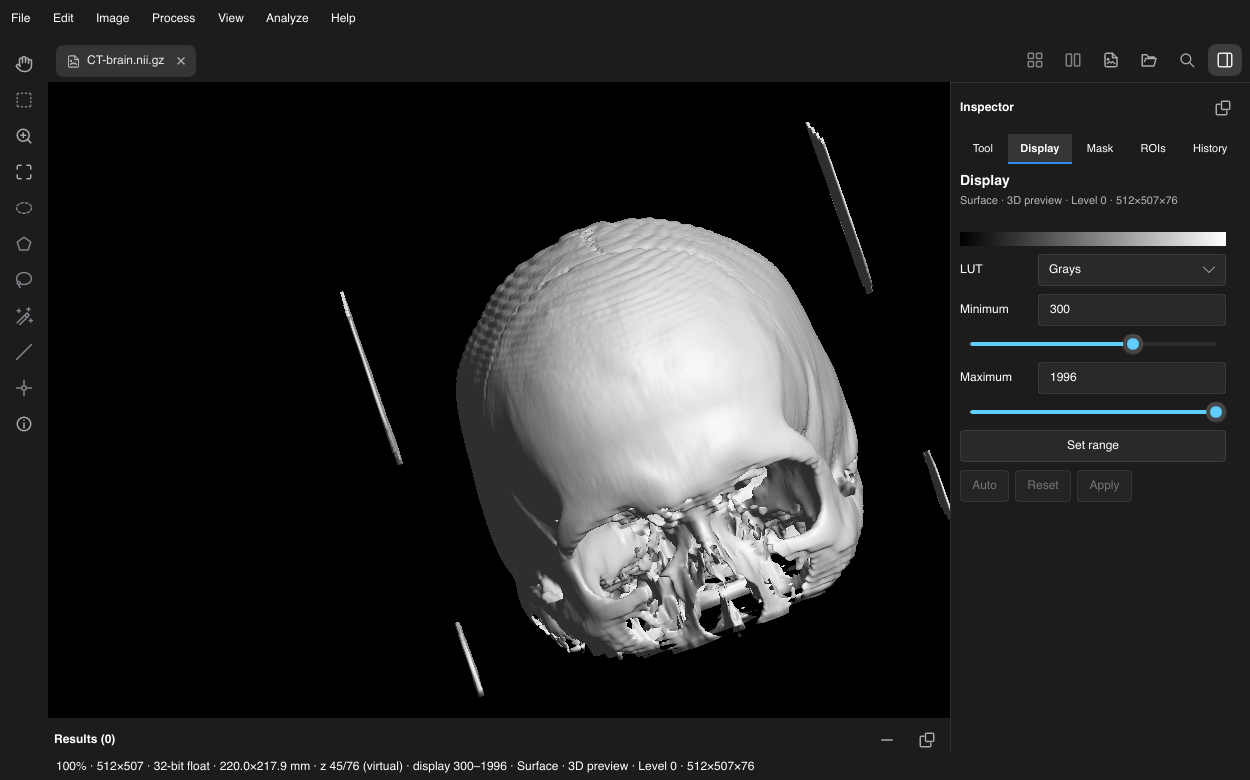
Choose a meaningful surface cutoff
- Inspect source XY/XZ/YZ planes first and check their intensity scale and spatial calibration.
- For this CTBrain sample, set Display Minimum to 300 and Maximum to 1996, then choose .
- Compare the visible boundary with the CT planes and adjust Minimum for the structure of interest. Keep a record of the value and dataset; a cutoff that works here may not work on another scan.
The distributed CTBrain file does not contain explicit intensity-unit/rescale metadata, so these settings are stated in original CT intensity values rather than certified HU. MRI intensity values use a different scale; a single MRI cutoff does not establish a brain or skull segmentation.
Understand preview resolution
Interactive 3D uses a display volume bounded to 256 MiB. Large data can use declared overviews or reduced display samples. MIP reduction uses maximum pooling to retain narrow bright features. During motion, sampling is reduced for responsiveness; settled rendering restores finer sampling. These decisions affect the preview, not source data.
A rendered pixel aggregates data along a ray and has no single corresponding source voxel. Use XY/XZ/YZ views for exact voxel cursor values and XY for quantitative selections and measurements.
Create an exact projection
Choose . Oxel creates a new maximum projection from every original Z slice, independently for each C/T combination. It preserves pixel type, channel metadata and XY calibration. This can require substantially more source reading than interactive rendering.
The output is a separate quantitative image, ready to inspect or save as TIFF.
10 · Explore
Large datasets & performance
A virtual image reads planes or regions as needed instead of decoding the whole dataset immediately. Zarr uses visible-region chunk reads and caches decoded 3D chunks across views. TIFF and other virtual sources use bounded plane/decoder reads. “Decoded image size” in Show Info describes the full pixel data, not the amount currently resident.
Choose a viewing resolution
When the source declares multiple resolutions, the Display inspector offers View resolution:
- Auto chooses a stored resolution for zoom and display density, then refines as navigation settles.
- Original requests original data for the view.
- Level choices force a particular stored overview. A coarse Z level represents the containing coarse voxel, not the exact original slice.
The status identifies the displayed level or a tile-budget limit. Selections stay in original coordinates when the displayed resolution changes. Exact cursor values, histograms, measurements, processing, and original-data exports continue to use full-resolution source samples.
Balance navigation and detail
Under Auto, Scrolling quality offers Match zoom, Balanced, and Faster previews. Balanced is the default; it starts with Level 2 when available and refines through Level 1 to the needed detail. Match zoom favors sharper navigation. Faster previews favors responsiveness. Movement can temporarily show an earlier complete overview beneath chunks that are still arriving.
Use memory previews and the data cache
For raw Zarr sources with suitable levels, Memory preview can retain a complete Level 2 or Level 3 backdrop in RAM. Loading shows progress and can be canceled. The overview must fit 256 MiB per image and 1 GiB across images. Off releases it. The explicit choice is remembered for later sources containing that level; it remains independent of View resolution.
Zarr data cache changes the shared decoded-chunk memory budget from 128 MiB to 8 GiB. The default is 512 MiB. Increasing it may help repeated visits to the same volume regions if RAM is available. It does not expand unsupported full-plane operations or force all source data into memory.
When to load into memory
materializes a virtual stack. Estimate its decoded size in Show Info first. This can improve repeated processing of a manageable image, but a many-gigabyte stack may exceed available memory. Use a substack or cropped copy when the task only needs a subset.
Editing pixels invalidates source overviews so an old pyramid is not shown over new values. Undo can restore the original source pyramid. Full-resolution histograms and exact projections may still take time even if an overview is instantly visible.
11 · Select
Selections & the Wand
A selection defines geometry. Drawing, moving, or resizing it leaves image pixels unchanged. Return to to draw and measure selections.
| Tool | Create and adjust |
|---|---|
| Select (rectangle) | Drag a rectangle. Drag inside to move, or drag handles to reshape. A click without a drag clears it. |
| Oval | Drag an oval. A click without a drag clears it. |
| Polygon | Click vertices. Enter, double-click, or click the first vertex to close. Drag existing vertices to adjust. |
| Freehand | Drag to trace a region; release to close it. |
| Line | Drag a line, then adjust endpoints. Line width controls measurement/profile sampling width in pixels. |
| Point | Click to place a point. |
| Wand | Click a pixel to grow a connected region through similar intensities or an active threshold. |
Combine regions
Area tools offer Replace / move, Add, Subtract, and Intersect in Tool. Draw a second region to combine it with the first. Return to Replace / move before repositioning a combined boundary. Arrows nudge a selection one pixel; Shift-arrows nudge ten. Esc cancels the current drawing action.
Set exact geometry
The Tool inspector exposes X, Y, Width, and Height for supported shapes, or endpoint coordinates for a line. Enter values and choose Update. Geometry fields use source pixels. Use for common changes.
Use the Wand reliably
- Choose Wand and set Tolerance (intensity units). A seed value of 100 with tolerance 10 admits connected pixels from 90 to 110. Tolerance 0 requires exact matches and can select one pixel in noisy data.
- Choose 4 neighbors (edges) or 8 neighbors (edges + corners). Eight-neighbor connectivity joins diagonally touching pixels.
- Click the current C/Z/T plane. RGB uses mean component intensity.
- To select one thresholded object, first set a Mask range, enable Use active threshold in Wand, then click within that range. The range replaces tolerance.
- Change settings and click again to regenerate the selection.
The Wand follows connected intensities; it does not detect semantic object boundaries. Check the outline at a useful zoom before measuring. A disconnected object needs another seed or an Add selection.
Transform the boundary
adjusts angle, scale, and XY offsets around the selection center. Preview shows a cyan outline; Apply changes the boundary. Enlarge / Shrink… accepts a positive/negative pixel distance. Make Band… creates an outer band excluding the original region. Make Inverse selects the complementary region.
12 · Select
Manage regions of interest
The ROI Manager is a shared collection of named selections. Choose the ROIs inspector or . The collection is available across documents, so select the correct image before restoring or measuring its regions.
- Draw a selection in XY and choose Add ROI in Tool, Add in ROIs, or press t.
- Choose Rename for a descriptive name. Stack ROIs retain their C/Z/T position; default names encode their location.
- Select a row to restore its selection. Oxel moves to its stored C/Z/T position when it fits the active image.
- Enable Show All to display the collected boundaries. This is a visual overlay; check coordinates and applicability when using the collection on another document.
- Choose Save… to save the whole collection. A single region can use
.roi; multiple regions use a ZIP set.
Measure saved regions
Measure in the ROI Manager measures all saved ROIs. Each uses its saved position if valid, otherwise the current C/Z/T plane. To measure only the restored selection, use instead.
Measure across C / Z / T… opens an explicit batch workflow. Choose all saved ROIs or the selected ROI, first/last channel, first/last Z, and first/last time. This reuses each boundary at every chosen position and ignores its saved position. Regions are clipped to image bounds. Enable Limit to source threshold only when the active source threshold should filter samples across every chosen channel.
Batch results append to the shared Results table. The dialog reports scope and progress; cancellation leaves the source unchanged. See the repeated-region workflow for a practical example.
Open or remove a collection
Open… accepts ImageJ ROI files and ZIP sets and appends supported regions to the collection. The status reports unsupported regions skipped during import. Delete removes the selected region; with no selected row it removes the collection. Unsaved region deletions prompt you to save first.
13 · Analyze
Spatial calibration
Spatial calibration converts pixel geometry to physical distances and areas. It also controls the displayed proportions of XY images and volume views. It does not change intensity units, register images, or resample a volume.
Enter XYZ spacing
- Choose .
- Enter Pixel width, Pixel height, Z spacing, and Unit of length. Values must be finite and positive.
- Apply and inspect to confirm the current calibration.
Use the acquisition metadata where available. For a 0.5 × 0.5 × 2 µm volume, enter 0.5, 0.5, and 2 with µm as the unit. Areas scale by pixel width × pixel height, and lengths follow the axis spacing. Entering pixel units removes physical calibration.
Calibrate from a known distance
- Draw a Line along a known reference distance.
- Choose . The line supplies the distance in pixels.
- Enter the known distance and unit, then Apply.
Set Scale creates an isotropic XY scale; it does not determine an independent Z spacing. Use Properties to enter the complete acquisition spacing. A known distance of 0 removes the scale.
Add a scale bar
Choose . Set its physical length (pixels when uncalibrated), thickness, font size, corner, and white/black color. You can hide its text. The bar is an overlay for presentation; PNG/JPEG exports and flattened RGB output burn it into rendered pixels. Source intensities remain unchanged while the overlay is displayed.
14 · Analyze
Thresholds & masks
A threshold classifies samples inside an intensity range. Open the Mask inspector or . Opening Mask only shows its controls. Choose Auto or Set range to preview a threshold; the red tint then marks values in range without changing source pixels.
- Choose the intended channel and representative Z/T position.
- Select an automatic method and the appropriate Dark background setting, then choose Auto; or enter numeric Lower and Upper limits and choose Set range.
- Inspect several slices to check whether the range captures real objects consistently. The numeric threshold is a source-intensity range, independent of the display LUT.
- Use Threshold overlay to hide/show the tint without removing the analysis range.
- Run Analyze Particles… directly on the thresholded source if you want object measurements without replacing intensities.
Convert values to a binary mask
Create mask… in Mask opens a new 8-bit image: 255 for samples inside the threshold range and 0 for background. The source pixels and threshold stay intact. For stacks, choose Current slice or Whole stack; whole stack includes every Z/T plane of the active channel and preserves calibration.
retains its image-conversion workflow:
- Single-channel source: the conversion goes through the processing-scope workflow and replaces the active document’s pixels. A type change locks the whole image to keep plane types consistent. Undo is available.
- Multichannel source: conversion with a live threshold extracts the active channel into a separate mask tab across that channel’s Z/T planes, preserving calibration. The composite source pixels remain intact.
From selection in Mask, or Selection Make mask, creates a new single-plane image from the selection boundary, irrespective of intensity threshold. Choose the route matching your analysis.
Clean up a binary mask
The commands require an 8-bit 0/255 mask. Erode shrinks foreground; Dilate expands it; Open removes small structures; Close- joins small gaps; Fill Holes fills enclosed background; Outline and Skeletonize derive boundaries or centerlines; Watershed separates touching regions. These change pixels and should be evaluated on a duplicate.
15 · Analyze
Measurements & profiles
Measure adds rows to Results. Each Label identifies the source image and measured region: shape, location and bounding size in source pixels, or a matching saved ROI name. With no selection it says Whole image. Labels are retained in CSV exports; measuring does not automatically add the selection to the ROI Manager.
measures the displayed full-resolution XY plane. Area selections limit the region; no selection measures the plane. A line reports line geometry and sampled intensity; points report their positions and values. Results append to a shared table across documents.
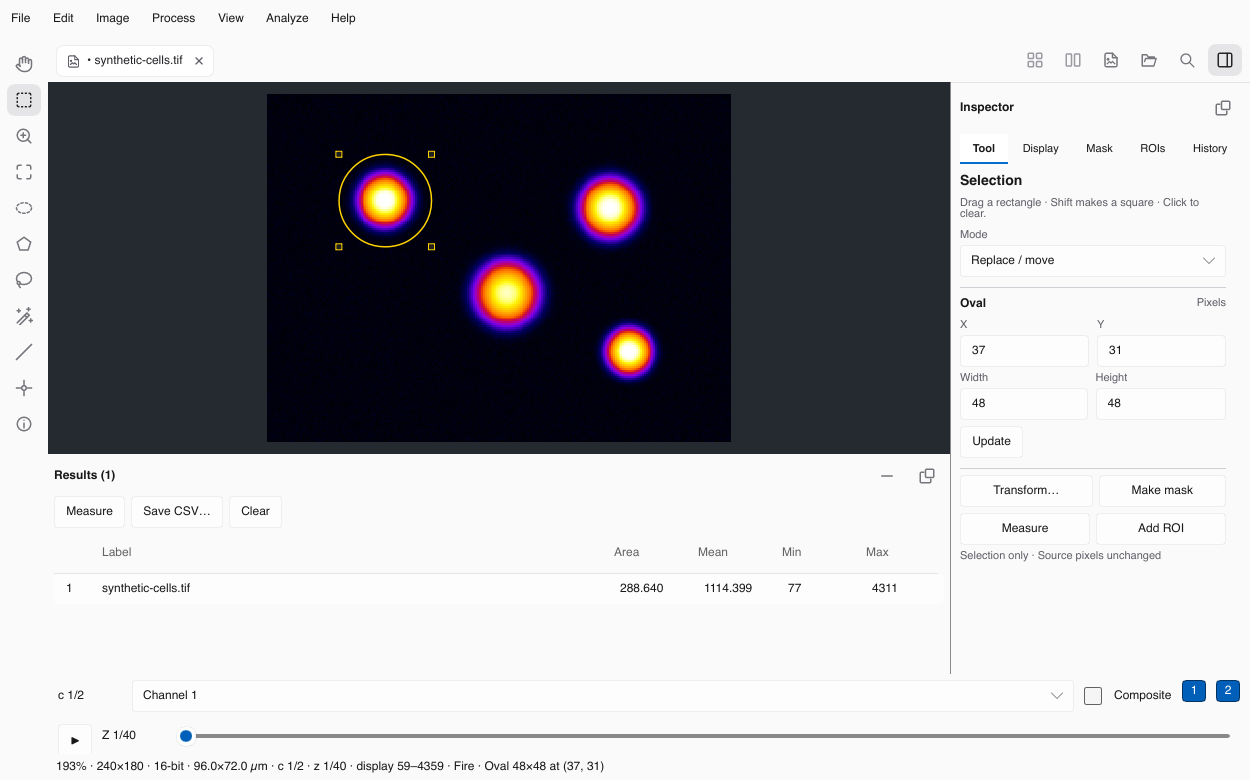
Choose reported quantities
Open . Changes affect future rows; earlier rows are retained. Area rows follow the selected quantity groups, while line and point rows retain their own relevant columns.
| Quantity | Interpretation |
|---|---|
| Area | Number of included pixels × calibrated pixel area. Pixel² without calibration. |
| Mean, StdDev, Min, Max, Median | Intensity statistics over included samples. Display brightness and LUT do not alter these numbers. |
| IntDen / RawIntDen | Area × mean intensity / sum of raw intensities. Calibration affects IntDen’s area term. |
| X / Y | Geometric centroid, using pixel centers and current spacing. |
| XM / YM | Intensity-weighted center of mass. Undefined when summed intensity is zero or invalid. |
| BX, BY, Width, Height | Bounding rectangle geometry in the current calibrated coordinate system. |
| Perim., Circ. | Perimeter and circularity. Circularity is based on 4π × area / perimeter², bounded to 0–1. |
| Major, Minor, Angle, AR, Round | Area-normalized moment ellipse, its orientation, aspect ratio, and minor/major ratio. |
| Feret, MinFeret, FeretAngle, FeretX, FeretY | Caliper diameters and related geometry derived from the measured boundary. |
| Solidity | Measured region area relative to its convex-hull area. |
| Mode, Skew, Kurt | Modal intensity and distribution moments. Float32 mode uses histogram bins; zero variance can make moments undefined. |
| %Area | Percentage of finite samples in the original region that fall in the source threshold; without a threshold, percentage of nonzero samples. Independent of the threshold-limited denominator used by other statistics. |
| Ch, Slice, Frame | One-based C/Z/T positions. Retain these for multidimensional analyses. |
Limit measurements to a threshold
Enable Limit to threshold in Set Measurements to include only source samples in the active threshold range. Hiding the red overlay does not disable that range. Check the range and selected channel before collecting rows. If no threshold is set, routine measurements use the region normally.
Measure intensity from another image
In Set Measurements, choose Measure intensity from. The source image defines regions, calibration, and threshold classification; the selected target supplies intensities. The target must have identical width/height, and each C/Z/T axis must match the source or have length 1, which repeats that axis. Oxel performs no registration or resizing. Verify alignment before using a segmentation to measure a second signal. Result labels identify the intensity image and mapped position.
Histograms and profiles
- displays a full-resolution histogram of the current plane or an area selection.
- samples along a line. Set width in Tool or ; width is measured in pixels.
- plots the region’s mean signal across Z for the active channel and time.
Undefined statistics can appear as NaN, and table blanks indicate a quantity was absent for that row. Empty thresholded regions or constant-valued distributions can legitimately leave some quantities undefined.
16 · Analyze
Count & measure particles
Analyze Particles detects connected foreground objects in each selected XY plane. It uses the source threshold, or an 8-bit 0/255 mask with white foreground. It appends object measurements without changing source pixels.
Count bright objects in a plane or stack
- Open the source, verify calibration, and select the intended channel. Return to XY.
- Set a threshold in Mask. Inspect foreground against the source at several representative Z/T positions. You do not have to create a mask.
- Optionally draw an area selection to restrict the analyzed region.
- Choose and select the quantities needed for your study.
- Choose . Enter a minimum and maximum Size or enable No maximum size. Size uses calibrated area units squared, or pixel².
- Set Circularity from 0 to 1. Start broadly while validating; values near 1 favor circular shapes.
- Choose edge exclusion, hole handling, and whether to Add to ROI Manager or Show masks (new image).
- Choose Choose region and planes…. Confirm Full image or Selection only, current/all channels, and the Z/T ranges. Check the plane-count summary, then choose Analyze.
- Review object rows in Results and compare the saved outlines or new mask with the source. Save Results CSV and any ROI set you want to retain.
You have object counts and measurements with explicit C/Z/T provenance.
Interpret the options
Exclude objects touching image or selection edges removes clipped objects at either boundary. With a selected region, objects are clipped to it first; exclusion treats the region boundary as an edge. Include holes includes enclosed holes in the object region. Show masks creates a separate image of accepted objects for the selected scope.
Connected-component detection uses diagonal connectivity, so corner-touching foreground samples can belong to one particle. Size and circularity filters remove detected objects outside the requested ranges. A source threshold is reused across all selected channels and planes; confirm that a shared range is meaningful before choosing All channels.
If using redirected intensity measurements, source thresholds and geometry still define each object, while the chosen target supplies its intensity statistics. Avoid changing or closing either image during analysis; results for a changed source are discarded so stale rows cannot silently appear.
17 · Process
Image processing & previews
Processing alters numeric pixels. Start from a duplicate or keep a source copy, select XY, and choose a command under . Many commands open a parameter dialog followed by an explicit scope dialog.
Confirm the region and planes
- Choose Full image or Selection only. A supported area selection is the default when one exists.
- Choose the current channel or All channels. Set first/last Z and time. Initial scope is the current C/Z/T plane for ordinary processing.
- Read the summary, including the number of planes. Use All Z and All T deliberately.
- Choose Preview… to compare Before and After where offered. The preview shows the first selected plane in a single channel and leaves the source unchanged.
- Return with Back to settings, revise if necessary, then choose Apply.
Geometry and pixel-type operations lock scope to every plane so the document stays consistent. Some operations only support the full image. With a selection-supported filter, pixels outside the boundary remain unchanged, although the filter can read neighbors outside it to calculate values inside.
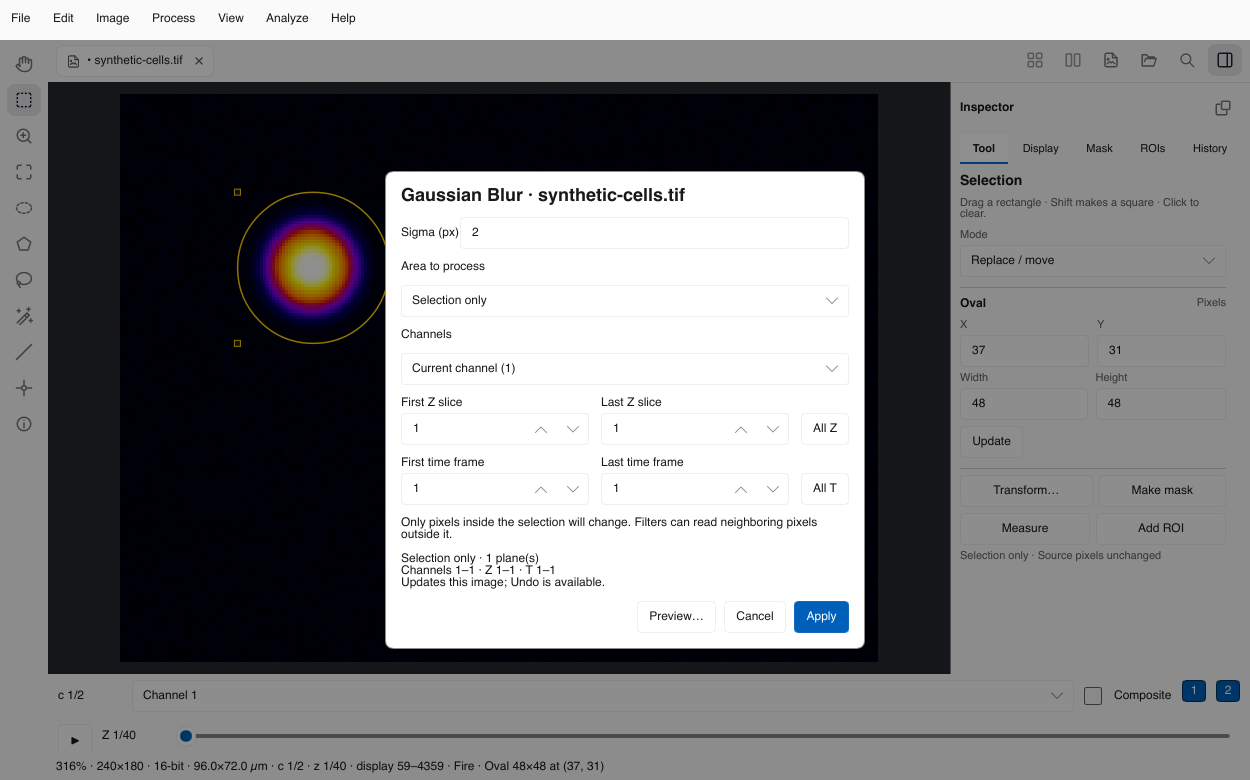
Choose a processing method
| Command group | Use and parameter interpretation |
|---|---|
| Smooth / Gaussian Blur | Reduce high-frequency variation. Gaussian sigma is in pixels, not physical units. |
| Median / Despeckle | Suppress isolated intensity spikes while retaining edges more than linear smoothing. Despeckle uses radius 1. |
| Mean / Minimum / Maximum / Variance | Neighborhood averaging, extrema, or variation. Radius uses pixels. Evaluate how the neighborhood changes object size or intensity. |
| Sharpen / Find Edges / Unsharp Mask | Emphasize intensity changes. Unsharp uses sigma and mask weight. Such outputs differ from raw intensity data. |
| Convolve | Enter a rectangular odd-sized kernel, one row per line. Choose Normalize kernel when its weights should be normalized. |
| Math | Add, subtract, multiply, divide, gamma and other numeric transformations. Integer output is bounded by its type. Use float32 for workflows needing negative/fractional values; division requires a nonzero divisor. |
| Subtract Background | Rolling-ball background estimate. Radius is in pixels; choose Light background when appropriate. Create background returns the estimate rather than subtracting it. Disable smoothing changes preprocessing. |
| Enhance Contrast | Set saturated-pixel percentage. Without Normalize/equalization it adjusts display contrast; Normalize (change pixel values) and histogram equalization alter data. Validate the result for quantitative workflows. |
| Noise | Add noise, remove outliers, or replace NaNs. These change samples; test on a duplicate. Remove Outliers uses radius, threshold, and bright/dark choice. |
| Image Calculator | Combine two compatible open images with a selected operation. Choose a 32-bit float result when needed. This does not align or register unmatched images. |
Reuse parameters during a session
In Processing preview, enter a name and choose Save preset. The Tool inspector’s Session presets list can reopen those operations on an image with the same channel count. Choose scope again for each use. Presets last for the current application session; they are not saved workflows or an automatic batch history.
Undo and History
and restore image edits and selection changes in the order they were made. Use Cmd-Z (macOS) or Ctrl-Z to undo drawing, moving, resizing, clearing, or combining selections; add Shift to redo. While drawing a polygon, undo removes the last vertex. History lists completed steps for the document and provides Undo/Redo buttons. Selection steps retain geometry only and do not change source pixels, zoom, or image save status. Display changes are not recorded there. Save status follows the saved image state, including restored calibration/display metadata.
If a source changes or closes while a settings dialog is open, cancel and reopen the command. This prevents applying stale settings to a different revision. Preserve settings externally when reproducibility requires a full audit trail.
18 · Edit
Edit pixels & geometry
Duplicate before an experiment
creates a separate image. Use a duplicate to test threshold conversion, filtering, type conversion, or geometry changes while retaining an open reference.
Copy, cut, and paste
copies the active plane or selected region. Cut additionally clears the source region. Paste places copied pixels as a movable floating paste; drag to reposition it. Paste as New Image opens copied content in a separate tab.
Copies made in Oxel can preserve original precision, display settings, and calibration while the system clipboard still matches that copy. Content coming from another application can have only display-image precision. uses a clipboard image when present; it captures the clipboard when the dialog opens. Choose Black, White, or Horizontal ramp to edit dimensions and type instead.
Fill, clear, or draw a boundary
fills using the foreground color, Clear uses the background color, Clear Outside clears outside the selection, and Draw paints a boundary. Configure colors under . Clear with no selection affects the whole current plane; stacks offer a current/all-plane choice. Undo is available. These commands edit pixels; a selected outline by itself does not.
Crop and resize
trims to the selection bounds. resamples width/height; a blank height preserves aspect ratio. Choose None, Bilinear, or Bicubic interpolation and whether to average when downsizing. changes the canvas dimensions with a chosen anchor position.
Scaling updates pixel pitch to preserve physical extent. A 90° turn swaps XY calibration. Check Properties after geometry changes, especially when later measurements depend on shape.
Rotate or translate pixels
offers flips, 90° turns, arbitrary Rotate…, and Translate…. Rotate previews the pixel result and accepts clockwise degrees, interpolation, and Enlarge to fit. For stacks, Continue… opens the scope step. Structural changes may lock all planes.
Convert pixel type
changes the scientific pixel type through an all-plane operation. Lower precision can lose intensity distinctions; conversion can use the current display range. Verify representative values and the resulting histogram before replacing an analysis source.
19 · Process
Stacks & derived images
These commands reorganize planes or create derived documents. They do not provide acquisition registration; input images need compatible dimensions, type, and intended alignment.
| Menu command | Behavior |
|---|---|
| Image → Color → Merge Channels (All Open Images) | Combine compatible open images as channels. Check which documents are open before using a command that operates on all of them. |
| Image → Color → Split Channels | Create separate documents for the source channels. |
| Image → Color → RGB Color (flatten view) | Create an RGB representation of rendered channels and display settings. Scientific scalar channels become presentation colors. |
| Image → Color → RGB Stack (split RGB) | Split stored RGB components into channel data and replace the active representation. |
| Image → Generate MIP… | Exact maximum across all original Z slices, independently per C/T, in a new image. |
| Image → Stacks → Z Project (Max), (Min), (Mean), (Sum), (Std Dev), or (Median) | Choose the corresponding exact menu item to create that projection across Z. Choose the statistic matching the question; sums and means have different meaning. |
| Make Substack… | Select Z slices using 1-10, 1,3,5, or 1-20-2 (start-end-step). Delete slices from original additionally alters the source document. |
| Reverse | Reverse the Z ordering in the active stack. |
| Concatenate (All Open Stacks) | Combine compatible open stacks in a new document. |
| Make Montage… | Create a tiled presentation of slices with selected columns/rows, scale, and border width. |
| Reslice XZ / YZ (entire stack) | Create a navigable stack through source Y / X, retaining C/T and adjusting calibration. Calibrated Z is interpolated to horizontal spacing. |
| Stack to Images | Open planes as separate single-plane documents. |
| Images to Stack | Combine compatible single-plane open images matching the active image’s dimensions and type. |
| Image → Hyperstacks | Reshape a flattened stack into known C/Z/T dimensions, or flatten a hyperstack. C varies fastest, then Z, then T; verify acquisition order before reshaping. |
Inspect the resulting dimensions, pixel type, calibration, and channels in Show Info. Projection or montage outputs can have new pixel types or display mappings; do not infer preservation from their screen appearance.
20 · Save & share
Save images, ROIs & results
Choose the output matching what you need to preserve. Saving a presentation image is different from saving a scientific image or an analysis table.
| Output | Command | Preserves |
|---|---|---|
| Scientific image with editing metadata | File → Save As → TIFF… | The whole current typed image, C/Z/T layout, calibration, display windows, and LUT metadata in ImageJ-compatible TIFF. Does not save the entire workspace, ROI collection, or Results. |
| Presentation image | File → Export (as displayed) → PNG… / JPEG… | The current XY plane’s rendered RGB appearance, including captured contrast, visible channels, threshold tint when active, and a burned-in scale bar. Reads original-resolution samples; does not preserve scientific pixel precision or stack axes. |
| Measurements | Results → Save CSV… | The accumulated table, labels, and numeric columns. Does not save image data or selected regions. |
| ROI collection | ROIs → Save… | Supported named regions and positions in ImageJ ROI / ZIP format. Does not save images or measurements. |
| Movie | File → Export Movie… | Rendered H.264 MP4 frames for an original-data sweep or 3D turntable. A presentation artifact, not a quantitative volume. |
Save a scientific image
Use and choose a descriptive destination. TIFF writes to a staging file and replaces the destination only after encoding and syncing succeed. Saving over a source managed by Oxel preserves the source revision used by open documents and undo history. External in-place modifications by another application are not snapshotted.
Save As in other formats
also offers PNG, JPEG, JPEG-LS, JPEG2000, Zarr, OME-Zarr, DICOM, MHA, MHD + RAW and NIfTI. The menu labels the saved scope. PNG, JPEG, JPEG-LS and JPEG2000 save the current original-resolution plane; volume formats save the whole dataset. Save As uses raw values; use Export (as displayed) for a composite or LUT-colored figure.
PNG and JPEG2000 accept unsigned 8/16-bit gray or RGB8. JPEG-LS accepts unsigned 8/16-bit gray. JPEG accepts 8-bit gray or RGB8 and is lossy. Arbitrary float values need TIFF, Zarr, MetaImage or NIfTI. DICOM accepts one unsigned gray or RGB8 channel, or exact integer values from −32768 to 32767 (including common CT data); incompatible types report an error so you can choose another format or convert explicitly.
Choose a new folder name for Zarr or OME-Zarr. For MHD, keep the header and its referenced RAW file together. You can reopen the MHD header or its matching RAW payload. Medical saves preserve current grid spacing but omit original patient identity and anatomical coordinates. Retain acquisition sources when those are needed.
TIFF saves the image's complete tracked display and calibration metadata. Other formats leave the source open and retain its unsaved status. The Save button in a close prompt uses TIFF. No image save includes Results or the ROI collection.
Choose a location outside a live Zarr store; TIFF exports into that store are rejected. Keep original acquisition files separately when provenance or original volume-format metadata matters.
Export a figure
Return to XY. Set the display range and LUTs, choose channels, hide the threshold tint if it is not part of the intended figure, and add a calibrated scale bar if needed. Export PNG for lossless rendered pixels or JPEG for a smaller lossy presentation file. The output captures the rendered full XY plane, not a screenshot of the zoomed viewport or surrounding UI. ROI outlines are not part of this image export.
Save a measurement table
Choose if hidden, then Save CSV…. Rows from different commands/images share columns; blank cells mean the row did not report that quantity. Keep source labels and C/Z/T positions. Saving does not clear the table; Clear asks you to preserve unsaved results first.
Archive one analysis
- Save the processed image as TIFF, keeping the acquisition source.
- Save the ROI set and Results CSV with the same analysis identifier.
- Record Oxel version (Help → About Oxel), source file identity, XYZ calibration, threshold, operation settings, scope, and any redirected intensity image.
- Reopen exported files when interchange is important and compare dimensions and representative values.
The image, geometry, results, and analysis decisions can be understood together.
21 · Save & share
Export movies
writes H.264 MP4 through the native macOS or Windows encoder. The dialog identifies whether the source is Original image data or the Current 3D display volume.
- Set the desired channel/time and display appearance before opening the dialog.
- Choose Through planes, Through time, or Turntable when a 3D scene is available.
- For a data sweep, choose XY, XZ, or YZ. Plane sweeps keep captured channel/time; time sweeps keep the current cut.
- Set First/Last, Width/Height, and Frames per second. Turntable additionally offers a frame count.
- Choose Save Movie…. Watch progress; use Stop to cancel an in-progress export.
Original-data sweeps sample the original grid and apply captured contrast/channel colors. A Turntable rotates the captured 3D display volume; its resolution and aggregation remain a preview. Output uses even dimensions, at most four million pixels per frame, and 1–120 fps. The completed destination is published only after encoding succeeds.
Export frame rate controls playback timing in the movie. It does not establish an acquisition time interval. Retain the scientific source and its timing metadata separately.
22 · Practical workflows
From inspection to a useful result
Measure the same region through Z or time
Goal: compare a fixed region across planes without redrawing it.
- Open and verify C/Z/T and calibration. Inspect several positions for movement; Oxel does not track a moving object automatically.
- In XY, draw the region and Add it to ROIs. Rename it with an experimental identifier.
- Choose Set Measurements and retain Mean, relevant intensity statistics, and Stack position. Clear or save previous Results if they belong to another analysis.
- In ROIs, choose Measure across C / Z / T…. Select the ROI, the intended channel range, and Z/T limits. Saved ROI positions are ignored in this workflow.
- Keep threshold limiting off unless intensity-based exclusion is part of the measurement definition. Inspect the summary and Measure.
- Save the ROI set and CSV. Compare rows by C/Z/T and check that the fixed region remained meaningful at every position.
A table of repeated measurements, with explicit positions and a reusable boundary.
Measure a second signal inside segmented objects
Goal: derive object boundaries from one image and measure intensities from an aligned image.
- Open the segmentation source and the intensity image. Verify identical width/height, compatible axes, and actual pixel alignment.
- Set the source threshold and validate classification.
- In Set Measurements, select the intensity image under Measure intensity from. The source retains geometry, calibration, and threshold decisions.
- Run Analyze Particles with appropriate size/circularity filters. Choose masks or ROIs for verification.
- Check source/target names in result labels. Review accepted boundaries against both datasets.
- Save CSV, ROIs, and a record of both source identities and processing settings.
Intensity values come from the target; objects and geometric quantities come from the source.
Inspect a medical volume without losing orientation provenance
- Open NIfTI or a DICOM series. Check C/Z/T, spacing, and modality intensity scaling in Show Info.
- Read the retained original affine and its coordinate convention. Stored XY/XZ/YZ cuts are not anatomical reorientation.
- Use linked Orthogonal views to inspect depth and crosshair correspondence.
- Return to XY for exact region measurements, recognizing that measurement geometry uses spacing rather than the full affine.
- Save a TIFF only as an image export; retain the original medical source and affine metadata for provenance and any downstream world-coordinate work.
Visual exploration stays connected to the source’s documented coordinate interpretation.
Prepare a clean figure
- Select the source plane, or create an exact Generate MIP output when a depth projection is appropriate.
- Set a documented display window and LUT. Choose consistent ranges across images when the comparison requires them.
- Verify calibration and add a scale bar.
- Hide threshold tint unless it communicates the segmentation intentionally.
- Export PNG from XY. Inspect the file and retain a TIFF/ROI/CSV record for the underlying analysis.
A shareable figure and a separate record of the scientific data behind it.
23 · Reference
Keyboard & mouse reference
Shortcuts act when the canvas/menu context is active. A text field can consume keys for editing. On macOS, menu modifiers use Cmd; Windows uses Ctrl.
| Action | macOS | Windows |
|---|---|---|
| Oxel Help | F1 (Fn-F1 if required by keyboard settings) | F1 |
| Open / New image / Save as TIFF / Close | Cmd-O / Cmd-N / Cmd-S / Cmd-W | Ctrl-O / Ctrl-N / Ctrl-S / Ctrl-W |
| Find Command | Cmd-Shift-P | Ctrl-Shift-P |
| Undo / Redo | Cmd-Z / Cmd-Shift-Z | Ctrl-Z / Ctrl-Shift-Z |
| Cut / Copy / Paste | Cmd-X / Cmd-C / Cmd-V | Ctrl-X / Ctrl-C / Ctrl-V |
| Paste as New Image | Cmd-Shift-V | Ctrl-Shift-V |
| Select All / Select None | Cmd-A / Cmd-Shift-A | Ctrl-A / Ctrl-Shift-A |
| Restore Selection | Cmd-Shift-E | Ctrl-Shift-E |
| Fill / Draw | Cmd-F / Cmd-D | Ctrl-F / Ctrl-D |
| Brightness/Contrast / Threshold | Cmd-Shift-C / Cmd-Shift-T | Ctrl-Shift-C / Ctrl-Shift-T |
| Show Info | Cmd-I | Ctrl-I |
| Duplicate / Crop | Cmd-Shift-D / Cmd-Shift-X | Ctrl-Shift-D / Ctrl-Shift-X |
| Measure / Histogram / Line profile | Cmd-M / Cmd-H / Cmd-K | Ctrl-M / Ctrl-H / Ctrl-K |
| Canvas control | Action |
|---|---|
| Shift + left drag / Space + drag | Temporary Pan with any tool selected. |
| + / − | Zoom in / out. |
| Zoom click / Alt-click or right-click | Zoom in / out with the Zoom tool. |
| Pinch | Continuous zoom around the gesture position on supported input devices. |
| , / . | Previous / next plane in the ordinary canvas. |
| Arrow / Shift-arrow | Nudge an active selection 1 / 10 pixels. Without a selection, left/right step through the stack. |
| t | Add the selection to ROI Manager. |
| Enter | Close a polygon. |
| Esc | Cancel the current selection drawing/preview; in Orthogonal, return to XY. |
| Delete / Backspace | Clear pixels inside the selection; with no selection, clear the whole current plane. Stacks offer current/all-plane scope. This is a pixel edit; Undo is available. |
| Wheel over Orthogonal pane | Move along that pane’s normal axis; Cmd/Ctrl-wheel zooms. |
| 3D drag / Shift + left drag / wheel or pinch | Rotate / pan / magnify MIP or Surface. |
In this guide: / focuses search; Esc clears search and closes the mobile contents panel. Browser Print is also available.
24 · Reference
Scientific fidelity & limits
Oxel distinguishes source data, current image data, and a rendered preview. Use these distinctions when comparing outputs or recording a quantitative method.
- Display window, LUT, visibility, zoom, and temporary overviews: alter visualization without changing original numeric samples.
- Threshold and selections: define analysis regions without changing intensities until converted, filled, or otherwise applied.
- Processing, Display Apply, type conversion, painting, and resampling: change current image pixels and require a saved scientific output if you want to retain them.
- PNG/JPEG, flattened RGB, and MP4: encode presentation appearance. They do not preserve original scientific precision.
- Interactive MIP/Surface: use a bounded display volume and ray sampling; exact Generate MIP reads original Z samples into a derived image.
Coordinates and measurement geometry
XY/XZ/YZ follow stored voxel axes. Medical affines are retained as original-source metadata but are not applied as anatomical reorientation or sheared measurement geometry. Calibration uses pixel width, height, and depth. The canvas uses float32 coordinates, so single-pixel cursor/ROI precision becomes limited above 16,777,216 pixels along an axis. Region file reads use checked integer coordinates independently of this UI limit.
Resource bounds
Plane display requests are limited to four million pixels per screen frame. 3D display volumes are bounded to 256 MiB. Zarr region reads cap at 64 MiB; decoded chunks and explicit full-plane operations cap at 256 MiB. Compressed NIfTI/MetaImage expansion has a 16 GiB temporary-file limit. NGFF retains up to 64 resolution levels. Collections are bounded to 16 nested levels, 10,000 entries, and 256 images; image plane descriptors across retained resolutions are bounded to one million.
These limits protect interactive use and can prevent an operation even when a tiled view is possible. A reported unsupported type, geometry, codec, or grid is an explicit limit; verify any conversion performed elsewhere rather than assuming it preserves the intended scientific interpretation.
Reproducibility
Keep acquisition sources stable, preserve processed TIFF/ROIs/CSV separately, and record source identity, version, calibration, thresholds, processing parameters, scope, and output format. Oxel does not currently save a complete project or an automatic reproducible processing script. Session presets and image-edit History do not replace an external method record.
25 · Support
Troubleshooting & FAQ
The image is black or washed out
Check the active channel, Visible, Composite, and Display Minimum/Maximum. Try Auto after the full-resolution histogram loads, or enter a known window. Confirm you are on a meaningful Z/T plane. Threshold tint can obscure normal colors; hide the overlay to inspect the source. Resetting the display does not undo a pixel-processing operation.
A volume looks stretched, flat, or unexpectedly oriented
Check XYZ spacing and units in Properties. Unit spacing can make thick slices appear physically wrong. Medical views follow stored axes rather than anatomical names; inspect the original affine in Show Info. An unsupported MetaImage/Zarr transform is rejected, not approximately applied.
Tools or commands are disabled, or request XY
Return with . Pixel editing and XY selections are unavailable in alternate cuts and 3D rendering. A command may also require a selection, a stack, an RGB source, or a loaded plane; check the status message and let loading complete.
The Wand selects one pixel, or much more than expected
Tolerance 0 matches exact values; increase it for noise. Check whether Use active threshold is enabled, because its range replaces tolerance. Four/eight-neighbor choices change diagonal joins. With RGB, Wand matches mean intensity. It follows connected intensities rather than detecting object edges. Reclick after changing settings.
Binary operations do nothing or report a mask requirement
A red threshold overlay is not yet a binary image. Use Mask Apply or Convert to Mask on a duplicate and confirm 8-bit 0/255 data. For a selection mask, use Tool → Make mask. Check whether your source is multichannel, because threshold Apply creates an extracted-channel mask tab.
Particle counts differ from visible objects
Inspect threshold coverage and accepted masks/ROIs. Check calibrated size limits, circularity, Include holes, and edge exclusion. Diagonally touching foreground can join; touching objects may need an evaluated watershed workflow. A physical 3D object may appear in multiple independent 2D rows. Selecting All channels can apply one threshold to signals with very different ranges.
Measurements are in pixels or unexpected units
Verify current calibration and the unit in Properties. Set Scale does not establish independent Z spacing. Area uses squared length units. Check that you measured the intended image and region; the ROI Manager is shared. If redirecting intensity, target intensities and source calibration have separate roles.
Results contain blanks or NaN
Blanks occur when a row did not report a column. NaN can mean an empty region, no samples inside a threshold, zero-variance distribution, or undefined center of mass. Inspect the ROI, band, and chosen statistics; do not replace undefined values with zero without a justified analysis rule.
Scrolling is slow or stays coarse
Look at the displayed-resolution and loading status. Try Auto and Balanced/Faster previews; fit or reduce zoom when an original-resolution request is large. A retained Memory preview can help repeated Zarr navigation; a larger Zarr cache can help chunk reuse when RAM allows. Histograms, exact cursor requests, measurements, and projections still need original samples. Do not equate a coarse visible backdrop with reduced measurement precision.
A file or folder will not open
Read the status error and compare with supported formats. For NIfTI pairs and detached MetaImage, check referenced payloads. For Zarr, select the store folder rather than a chunk file. Check codecs, axes, and unsupported transforms. DICOM needs a regular unambiguous grid. Large sequences may hit the operating system’s open-file limit; consolidate through a validated workflow if needed.
A processing dialog says the source changed or closed
Cancel and reopen the command on the intended image. Source-bound processing/measurement jobs reject obsolete revisions. If using a redirected intensity image, keep it open and stable as well.
TIFF does not restore my whole analysis
TIFF saves the image and supported image metadata. ROI collections and Results have separate save commands, and the workspace is not a saved project. Reopen the TIFF, open its ROI ZIP, and use the saved CSV for the table in a spreadsheet or analysis application.
PNG/JPEG export requests XY or differs from my zoomed canvas
The command exports a rendered full-resolution XY plane, not the viewport or 3D canvas. PNG/JPEG retain the source raster width and height; the canvas’s correction for non-square calibrated pixels is not resampled into these export pixels. Return to XY or create an exact projection. Check captured channel visibility, display window, threshold tint, and scale bar. Use Export Movie for a 3D Turntable.
A movie cannot be encoded
Export Movie uses the native Windows/macOS H.264 encoder. Read the dialog’s error, choose even dimensions within the pixel limit and a supported frame rate, and check destination disk space/access. If the system encoder fails, the completed destination is not published. Keep the source and settings available to retry.
What should I include in a support request?
Include Oxel version from Help → About Oxel, operating system, file format, dimensions/type/C/Z/T, relevant calibration, the exact action, expected/actual result, and the visible error. A small non-sensitive reproducible dataset is more useful than an unexplained screenshot. Contact info@oxellabs.com.
26 · Reference
Glossary
- Calibration
- The length represented by one sample along X/Y/Z and its unit. Used for geometric measurements and volume proportions.
- Channel
- An independent signal plane at each Z/T position. Different from color components stored together as RGB.
- Composite
- A rendered blend of visible channels using their individual display windows and LUTs.
- Display range / window
- The intensity interval mapped to the available display brightness/color range.
- Hyperstack
- A multidimensional image with explicit channel, depth, and time axes.
- Histogram
- The distribution of sampled intensity values. A float histogram uses bins rather than an entry for every possible value.
- LUT · lookup table
- A mapping from scalar intensity to display colors. Changing a LUT does not change scalar samples.
- Mask
- An image classifying foreground and background; Oxel’s binary operations use 8-bit values 255 and 0.
- MIP · maximum-intensity projection
- Maxima along a projection direction. An interactive 3D MIP is a display preview; Generate MIP creates an exact original-Z maximum image.
- Original source
- The imported acquisition data and its metadata before image edits. Current image pixels may differ after processing.
- Overview / pyramid
- A stored lower-resolution representation used to display large data efficiently.
- Particle
- A connected foreground region in an analyzed XY plane, filtered by size/circularity and other options.
- Plane
- One two-dimensional image, usually XY at a chosen C/Z/T position; a cross-section can instead show XZ or YZ.
- ROI · region of interest
- A saved selection boundary or geometry used for display, repeated measurement, or processing scope.
- Scope
- The explicit image region, channels, Z slices, and time frames affected by an operation.
- Virtual image
- An image whose pixels load from the source as needed rather than all being decoded at open time.
- Voxel
- A sampled element of a volume, associated with physical XYZ spacing.
27 · Support
Support, training & credits
This version of Oxel is free to use under the proprietary license supplied with the official release. Optional support and training help fund continued development. Future releases or premium features may have different prices and terms.
Support Oxel
Visit oxellabs.com for information about supporting development and the project.
Training for your workflow
Discuss individual or lab training, image-analysis workflows, and organizational needs at info@oxellabs.com.
CT and MRI image credits
CT-MR Brain / CTBrain (CT-brain.nrrd) and MRHead (MR-head.nrrd) are public acquired sample datasets distributed by the 3D Slicer project. Its sample-data acknowledgements record unrestricted donations by the people pictured. Source downloads: CTBrain and MRHead.
The illustrations are derived renderings made in Oxel, with chosen display ranges and camera angles. NRRD was converted to NIfTI float32 with all sample values preserved, and the source spatial transform retained within NIfTI precision. MRI axes were permuted/flipped without interpolation; CT retained its original voxel grid. No filtering, intensity normalization or anatomical segmentation was performed. The other workspace, processing and measurement examples remain labeled synthetic data.
The attributed scan content retains the 3D Slicer agreement; Oxel’s proprietary terms do not replace those rights. No endorsement by Slicer, Brigham or the contributors is implied. The full applicable notice is included below for offline use.
3D Slicer sample-data license and required notice
NOTICE FOR CT-MR BRAIN AND MRHEAD IMAGE CONTENT ONLY

The scan content in the attributed Oxel screenshots is derived from these
3D Slicer sample datasets. This notice applies to that content, not to
Oxel application code or branding. The source data retains its own terms.

All or portions of this licensed product (such portions are the "Software")
have been obtained under license from The Brigham and Women's Hospital, Inc.
and are subject to the following terms and conditions:


For more information, please see:

                      https://www.slicer.org

The 3D Slicer license below is a BSD style license, with extensions
to cover contributions and other issues specific to 3D Slicer.


3D Slicer Contribution and Software License Agreement ("Agreement")
Version 1.0 (December 20, 2005)

This Agreement covers contributions to and downloads from the 3D
Slicer project ("Slicer") maintained by The Brigham and Women's
Hospital, Inc. ("Brigham"). Part A of this Agreement applies to
contributions of software and/or data to Slicer (including making
revisions of or additions to code and/or data already in Slicer). Part
B of this Agreement applies to downloads of software and/or data from
Slicer. Part C of this Agreement applies to all transactions with
Slicer. If you distribute Software (as defined below) downloaded from
Slicer, all of the paragraphs of Part B of this Agreement must be
included with and apply to such Software.

Your contribution of software and/or data to Slicer (including prior
to the date of the first publication of this Agreement, each a
"Contribution") and/or downloading, copying, modifying, displaying,
distributing or use of any software and/or data from Slicer
(collectively, the "Software") constitutes acceptance of all of the
terms and conditions of this Agreement. If you do not agree to such
terms and conditions, you have no right to contribute your
Contribution, or to download, copy, modify, display, distribute or use
the Software.

PART A. CONTRIBUTION AGREEMENT - License to Brigham with Right to
Sublicense ("Contribution Agreement").

1. As used in this Contribution Agreement, "you" means the individual
   contributing the Contribution to Slicer and the institution or
   entity which employs or is otherwise affiliated with such
   individual in connection with such Contribution.

2. This Contribution Agreement applies to all Contributions made to
   Slicer, including without limitation Contributions made prior to
   the date of first publication of this Agreement. If at any time you
   make a Contribution to Slicer, you represent that (i) you are
   legally authorized and entitled to make such Contribution and to
   grant all licenses granted in this Contribution Agreement with
   respect to such Contribution; (ii) if your Contribution includes
   any patient data, all such data is de-identified in accordance with
   U.S. confidentiality and security laws and requirements, including
   but not limited to the Health Insurance Portability and
   Accountability Act (HIPAA) and its regulations, and your disclosure
   of such data for the purposes contemplated by this Agreement is
   properly authorized and in compliance with all applicable laws and
   regulations; and (iii) you have preserved in the Contribution all
   applicable attributions, copyright notices and licenses for any
   third party software or data included in the Contribution.

3. Except for the licenses granted in this Agreement, you reserve all
   right, title and interest in your Contribution.

4. You hereby grant to Brigham, with the right to sublicense, a
   perpetual, worldwide, non-exclusive, no charge, royalty-free,
   irrevocable license to use, reproduce, make derivative works of,
   display and distribute the Contribution. If your Contribution is
   protected by patent, you hereby grant to Brigham, with the right to
   sublicense, a perpetual, worldwide, non-exclusive, no-charge,
   royalty-free, irrevocable license under your interest in patent
   rights covering the Contribution, to make, have made, use, sell and
   otherwise transfer your Contribution, alone or in combination with
   any other code.

5. You acknowledge and agree that Brigham may incorporate your
   Contribution into Slicer and may make Slicer available to members
   of the public on an open source basis under terms substantially in
   accordance with the Software License set forth in Part B of this
   Agreement. You further acknowledge and agree that Brigham shall
   have no liability arising in connection with claims resulting from
   your breach of any of the terms of this Agreement.

6. YOU WARRANT THAT TO THE BEST OF YOUR KNOWLEDGE YOUR CONTRIBUTION
   DOES NOT CONTAIN ANY CODE THAT REQUIRES OR PRESCRIBES AN "OPEN
   SOURCE LICENSE" FOR DERIVATIVE WORKS (by way of non-limiting
   example, the GNU General Public License or other so-called
   "reciprocal" license that requires any derived work to be licensed
   under the GNU General Public License or other "open source
   license").

PART B. DOWNLOADING AGREEMENT - License from Brigham with Right to
Sublicense ("Software License").

1. As used in this Software License, "you" means the individual
   downloading and/or using, reproducing, modifying, displaying and/or
   distributing the Software and the institution or entity which
   employs or is otherwise affiliated with such individual in
   connection therewith. The Brigham and Women's Hospital,
   Inc. ("Brigham") hereby grants you, with right to sublicense, with
   respect to Brigham's rights in the software, and data, if any,
   which is the subject of this Software License (collectively, the
   "Software"), a royalty-free, non-exclusive license to use,
   reproduce, make derivative works of, display and distribute the
   Software, provided that:

(a) you accept and adhere to all of the terms and conditions of this
Software License;

(b) in connection with any copy of or sublicense of all or any portion
of the Software, all of the terms and conditions in this Software
License shall appear in and shall apply to such copy and such
sublicense, including without limitation all source and executable
forms and on any user documentation, prefaced with the following
words: "All or portions of this licensed product (such portions are
the "Software") have been obtained under license from The Brigham and
Women's Hospital, Inc. and are subject to the following terms and
conditions:"

(c) you preserve and maintain all applicable attributions, copyright
notices and licenses included in or applicable to the Software;

(d) modified versions of the Software must be clearly identified and
marked as such, and must not be misrepresented as being the original
Software; and

(e) you consider making, but are under no obligation to make, the
source code of any of your modifications to the Software freely
available to others on an open source basis.

2. The license granted in this Software License includes without
   limitation the right to (i) incorporate the Software into
   proprietary programs (subject to any restrictions applicable to
   such programs), (ii) add your own copyright statement to your
   modifications of the Software, and (iii) provide additional or
   different license terms and conditions in your sublicenses of
   modifications of the Software; provided that in each case your use,
   reproduction or distribution of such modifications otherwise
   complies with the conditions stated in this Software License.

3. This Software License does not grant any rights with respect to
   third party software, except those rights that Brigham has been
   authorized by a third party to grant to you, and accordingly you
   are solely responsible for (i) obtaining any permissions from third
   parties that you need to use, reproduce, make derivative works of,
   display and distribute the Software, and (ii) informing your
   sublicensees, including without limitation your end-users, of their
   obligations to secure any such required permissions.

4. The Software has been designed for research purposes only and has
   not been reviewed or approved by the Food and Drug Administration
   or by any other agency. YOU ACKNOWLEDGE AND AGREE THAT CLINICAL
   APPLICATIONS ARE NEITHER RECOMMENDED NOR ADVISED. Any
   commercialization of the Software is at the sole risk of the party
   or parties engaged in such commercialization. You further agree to
   use, reproduce, make derivative works of, display and distribute
   the Software in compliance with all applicable governmental laws,
   regulations and orders, including without limitation those relating
   to export and import control.

5. The Software is provided "AS IS" and neither Brigham nor any
   contributor to the software (each a "Contributor") shall have any
   obligation to provide maintenance, support, updates, enhancements
   or modifications thereto. BRIGHAM AND ALL CONTRIBUTORS SPECIFICALLY
   DISCLAIM ALL EXPRESS AND IMPLIED WARRANTIES OF ANY KIND INCLUDING,
   BUT NOT LIMITED TO, ANY WARRANTIES OF MERCHANTABILITY, FITNESS FOR
   A PARTICULAR PURPOSE AND NON-INFRINGEMENT. IN NO EVENT SHALL
   BRIGHAM OR ANY CONTRIBUTOR BE LIABLE TO ANY PARTY FOR DIRECT,
   INDIRECT, SPECIAL, INCIDENTAL, EXEMPLARY OR CONSEQUENTIAL DAMAGES
   HOWEVER CAUSED AND ON ANY THEORY OF LIABILITY ARISING IN ANY WAY
   RELATED TO THE SOFTWARE, EVEN IF BRIGHAM OR ANY CONTRIBUTOR HAS
   BEEN ADVISED OF THE POSSIBILITY OF SUCH DAMAGES. TO THE MAXIMUM
   EXTENT NOT PROHIBITED BY LAW OR REGULATION, YOU FURTHER ASSUME ALL
   LIABILITY FOR YOUR USE, REPRODUCTION, MAKING OF DERIVATIVE WORKS,
   DISPLAY, LICENSE OR DISTRIBUTION OF THE SOFTWARE AND AGREE TO
   INDEMNIFY AND HOLD HARMLESS BRIGHAM AND ALL CONTRIBUTORS FROM AND
   AGAINST ANY AND ALL CLAIMS, SUITS, ACTIONS, DEMANDS AND JUDGMENTS
   ARISING THEREFROM.

6. None of the names, logos or trademarks of Brigham or any of
   Brigham's affiliates or any of the Contributors, or any funding
   agency, may be used to endorse or promote products produced in
   whole or in part by operation of the Software or derived from or
   based on the Software without specific prior written permission
   from the applicable party.

7. Any use, reproduction or distribution of the Software which is not
   in accordance with this Software License shall automatically revoke
   all rights granted to you under this Software License and render
   Paragraphs 1 and 2 of this Software License null and void.

8. This Software License does not grant any rights in or to any
   intellectual property owned by Brigham or any Contributor except
   those rights expressly granted hereunder.

PART C. MISCELLANEOUS

This Agreement shall be governed by and construed in accordance with
the laws of The Commonwealth of Massachusetts without regard to
principles of conflicts of law. This Agreement shall supercede and
replace any license terms that you may have agreed to previously with
respect to Slicer.
Application information and Slint
Choose for the application version and toolkit acknowledgement. Oxel’s interface is built with Slint. The application includes Slint’s AboutSlint acknowledgement.
This guide is bundled with the application and works offline. External website/email links require the appropriate connection or mail application. Search uses the local guide content; no online search service is required.